SciComm
Collection of cool science comunication and visualization projects.
TEDxUniversityofDelaware
I am a speaker at the TEDxUniversityofDelaware event held November 2025. I will share climate science through storytelling of climate’s fingerprint on human history and experience. More info here: https://tedx.udel.edu/.
ENSO Blog (Climate.gov)
I contributed to this ENSO Blog post on the 2025 Tornado Season: https://www.climate.gov/news-features/blogs/enso/tornado-season-2025-active-through-april-and-may-keeping-pace.
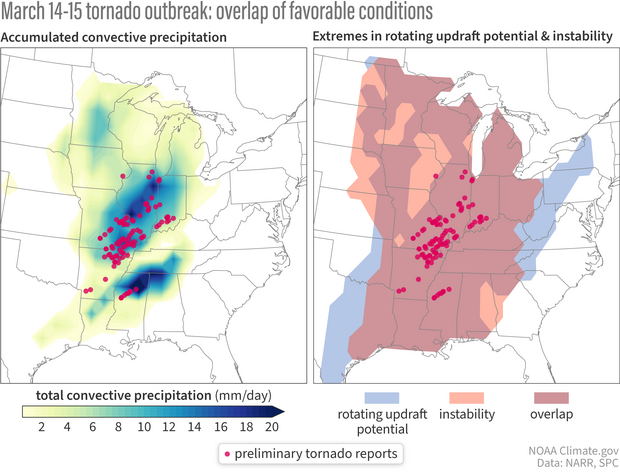
Tornado activity (red dots) during the March 14-15, 2025, outbreak was concentrated in areas where heavy convective rainfall (left map, darkest blue areas) overlapped with the areas of extreme atmospheric instability (right map, orange shading) and wind shear/rotation potential (right map, blue shading).
Seasoned Chaos
Sometimes I create images, animations, etc. related or not related to weather and climate. You can find some of my scripts and output at my fun-data-science repo
Most of my science communication work is done through Seasoned Chaos blog posts. My writer bio page lists all the posts I have (co-)written. We also keep a Github repository with some of the scripts used to create some of the figures/animations, which I have contributed to extensively.
Lorenz Butterfly
This animation shows that the tiniest pertubations in initial conditions can result in such different outcomes. Learn more about this phenomena in this Seasoned Chaos blog post.
Large-scale Setup for Severe Storms
While severe convective storms are largely triggered and described by small-scale/mesoscale processes, the large-scale environment can still influence the likelihood of severe convective storm conditions. Here is an example of favorable synoptic-scale conditions and how that may describe the pattern of springtime likelihood of tornado/hail/wind events across U.S. Learn more about how severe covective storms may be influenced by climate in this Seasoned Chaos blog post.
El Niño-Southern Oscillation (ENSO)
ENSO develops in the tropical Pacific and can be characterized by a feedback loop between the sea surface temperatures, surface winds, and thermocline. By clicking on an element of the loop, you should get a new image that shows thermocline, SST, or wind conditions during each of the phases of ENSO (warm El Niño, cool La Niña, or neutral). Learn more about ENSO in this Seasoned Chaos blog post.
![]()
![]()
![]()
Weather Pattern Pie: Visualization of the Timescales of Climate System
This interactive image was created for this Seasoned Chaos blog post. It shows all the timescales of the weather and climate system and the processes that go into forecasting the different scales. The interactive part allows you to click the timescales to focus on the particular processes; by hovering over the pie pieces, you can find a brief description. This image does not indicate any actual percentages of variability for each process nor is it an exhaustive list. Also, a process may belong to more than one parent timescale (e.g. ENSO can be seasonal or year-to-year).
Other Graphics
Subseasonal-to-Seasonal Forecasting: A “Bridge” between Weather and Climate

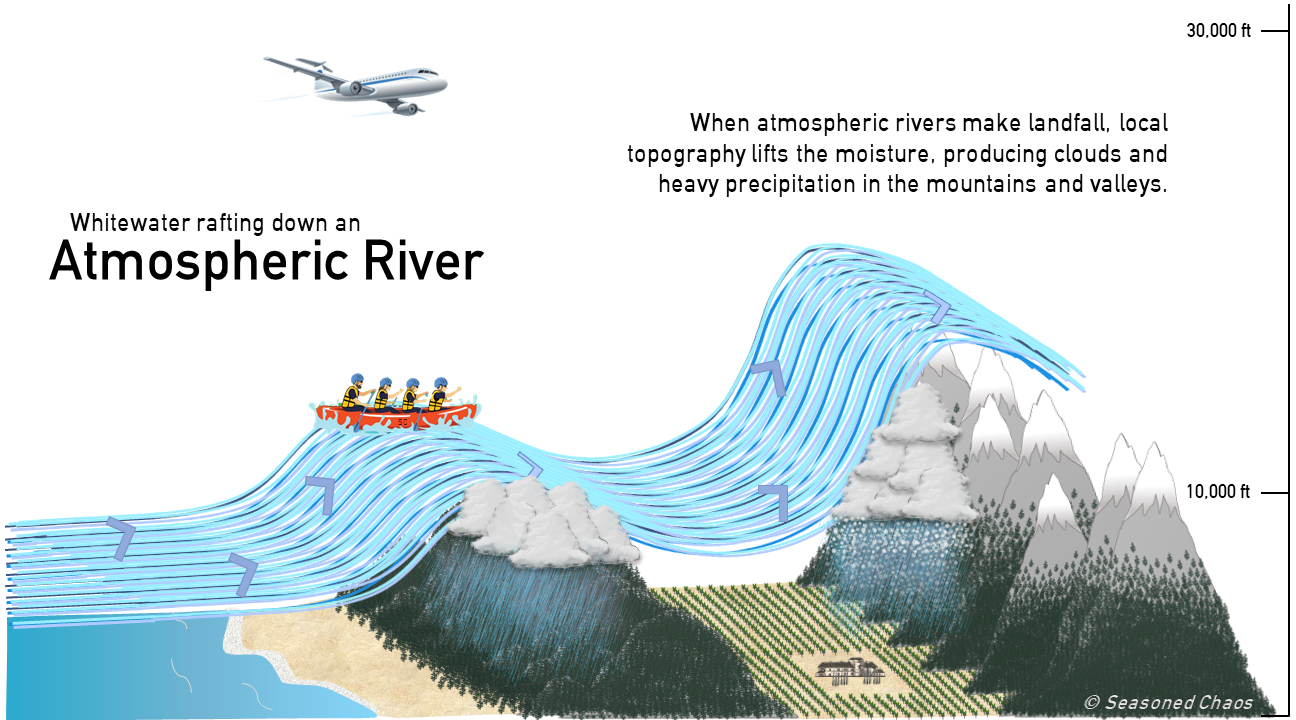
Atmospheric Rivers
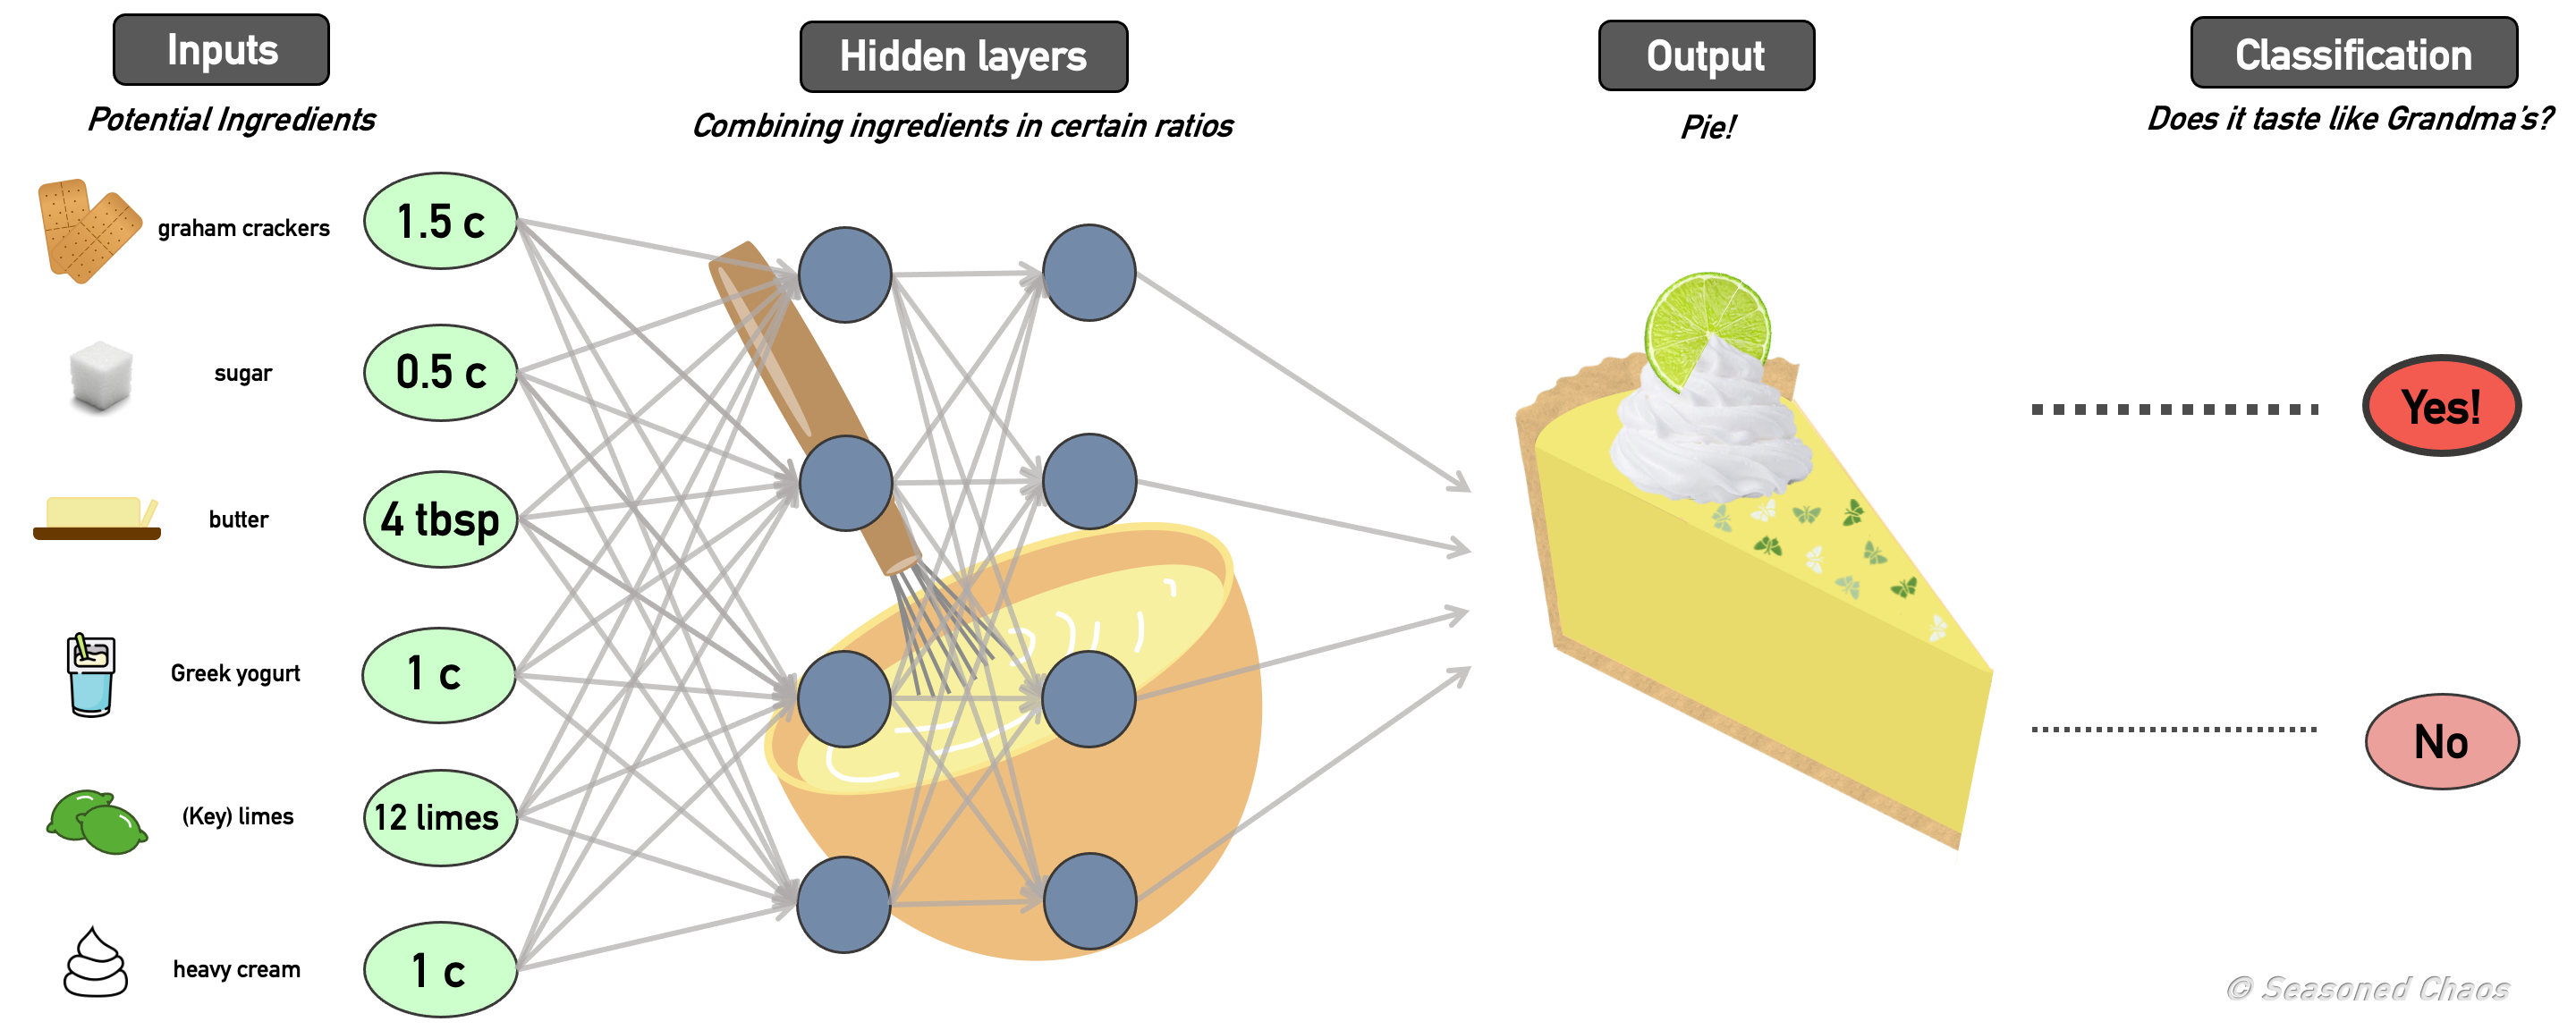
Artificial Neural Network
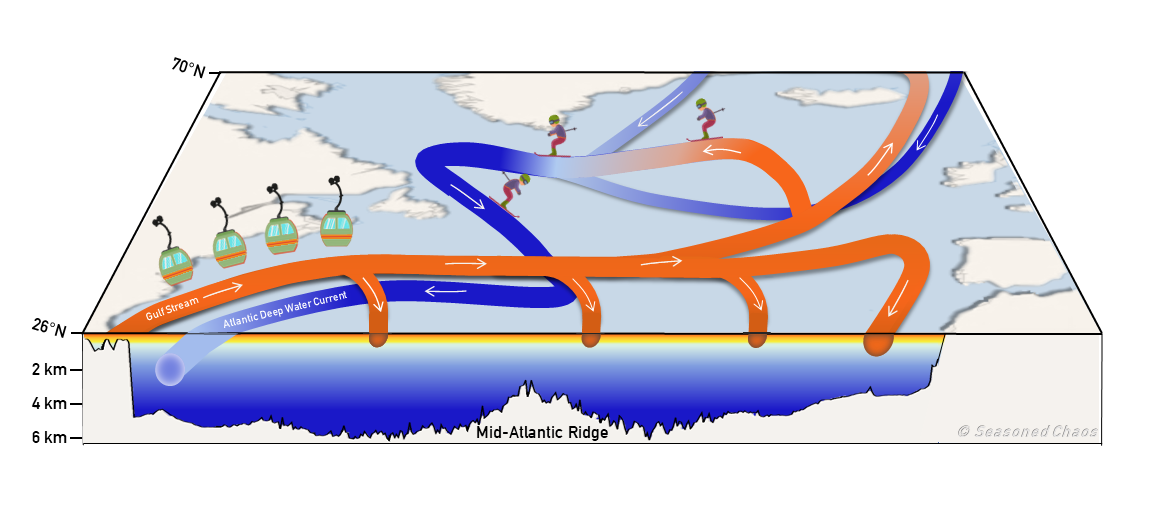
Atlantic Meridional Overturning Circulation
Climate Forecasting and ENSO


